| August 4, 2021
We raised two clutches of baby Furcifer pardalis (Panther Chameleons) under controlled conditions to answer a simple question:
How do the growth rates of baby Panther Chameleons raised under UVI 3 and UVI 6 compare?
Background
Michael Nash recently studied two groups of baby Furcifer lateralis and found that UVI 7 and UVI 3 resulted in no noticeable difference in growth rates for that species. He descibes his research in this post. This was an inspiring example of research in the hobby, and I would love to see more people get involved!
Gary W. Ferguson has published the most content on UVI and dietary A/D3 supplementation of Furcifer pardalis in captivity. He and a group of researchers published one of the first studies titled, Indoor husbandry of the panther chameleon Chamaeleo [Furcifer] pardalis: Effects of dietary vitamins A and D and ultraviolet irradiation on pathology and life-history traits, Gary W. Ferguson et al. (1996). In their 1996 study, they varied dietary supplements and UVI for pardalis for a full year and observed the females’ ability to lay and their offsprings’ vitality. This standard of evidence is the gold standard in the field. Their findings are the basis for our husbandry recommendations today: medium UV-B irradiation, low UV-A irradiation, and Goldilocks levels of supplementation because too much A/D3 resulted in soft tissue mineralization and a shortened lifespan in females, whereas not enough resulted in the inability to reproduce and other “gross and histological pathologies”. Interestingly, they found that every test group, regardless of their UVI and A/D3 level, exhibited hepatocellular lipidosis (“Fatty Liver”). My first chameleon, Flash, died from this, so I would love to know if someone has more information on the cause. We were both feeding Achaeta domestica (domestic crickets) ad libitum which results in obesity and is one of the leading causes of hepatic lipidosis, so that’s a decent hypothesis. I have since reduced my feeding levels and Jude is nearing 5 years old.
Ferguson et al. followed their 1996 study with Ultraviolet Light Requirements of Panther Chameleons in Captivity, G. W. Ferguson et al. (1999), which attempted to determine optimal levels of UVI with low dietary D3 supplementation, and Effects of Artificial Ultraviolet Light Exposure on Reproductive Success of the Female Panther Chameleon (Furcifer pardalis) in Captivity, Gary W. Ferguson et al. (2002), which focused specifically on females. Females under lower levels of UVB had trouble reproducing successfully, but medium levels for 12 hrs per day resulted in successful reproduction and low mortality rates. They also found that high D3 diets helped prevent mortality but did not “correct the embryonic term death.” That medium level is roughly a UVI of 3 on a Solarmeter 6.5 even though they used different equipment in their studies.
The next big area of research was in basking behavior. Gary W. Ferguson et al. (2003) and Karsten et al. (2009) both found that Furcifer pardalis will bask more when fed lower D3 diets and bask less when fed high D3 diets. They will also regulate their exposure based on the UV-B intensity. So after reading that, I would expect the difference between UVI 6 and 3 to be a null result in our study. My assumption is that the neonates raised under UVI 6 will just bask less to reach optimal D3 levels and those raised under UVI 3 will bask more. However, the highest UVI levels have resulted in poor hatch rates and neonate success in future generations, so their ability to regulate UVB exposure clearly has a limit.
Check out the citations at the end of this article for details. Many of the pdfs are available for free, but a few are hidden behind the academic wall of shame.
Methods
We designed 6 cages under a maximum UVI of 3 and 6 cages under a maximum UVI of 6. In this experiment, we controlled for diet, cage size and decor but not genetics. Future studies will use babies from the same clutch in order to ensure that genetics are less likely the cause of any observed difference in growth rates. The neonates were fed primarily fruit flies for the first few weeks followed by bean beetles and pin head crickets and larger sizes as their growth permitted (space between their eyes > size of the feeder). Every cage has drainage, abg mix, leaf litter, springtails and isopods. The neonates were individually placed in their cages on the same day they hatched. They were supplemented with Repashy Calcium Plus LoD twice a month and plain calcium w/ bee pollen each feeding in between.
Results
Although the group raised under a maximum UVI of 6 had a few large neonates, the difference was not statistically significant. If we increased our sample size and used animals with the exact same genetics, it may have been significant. We’ll have to repeat this study to find out.

This plot shows one line per neonate with three weight measurements taken on the same date, two weeks apart. You can see the growth rate from the change in distance from left to right. The color indicates what the maximum UVI was for a given neonate.
Characteristic | MAX UVI Level: 3, N = 18 | Max UVI Level: 6, N = 18 | p-value |
|---|---|---|---|
| Cage | <0.001 | ||
| A | 3 (17%) | 0 (0%) | |
| B | 3 (17%) | 0 (0%) | |
| C | 3 (17%) | 0 (0%) | |
| D | 3 (17%) | 0 (0%) | |
| E | 3 (17%) | 0 (0%) | |
| F | 3 (17%) | 0 (0%) | |
| G | 0 (0%) | 3 (17%) | |
| H | 0 (0%) | 3 (17%) | |
| I | 0 (0%) | 3 (17%) | |
| J | 0 (0%) | 3 (17%) | |
| K | 0 (0%) | 3 (17%) | |
| L | 0 (0%) | 3 (17%) | |
| Row | <0.001 | ||
| 1 | 18 (100%) | 0 (0%) | |
| 2 | 0 (0%) | 18 (100%) | |
| Hatch Date | <0.001 | ||
| 6/3/2021 | 0 (0%) | 18 (100%) | |
| 6/5/2021 | 18 (100%) | 0 (0%) | |
| Weigh Date | >0.9 | ||
| 7/27/2021 | 6 (33%) | 6 (33%) | |
| 8/11/2021 | 6 (33%) | 6 (33%) | |
| 8/24/2021 | 6 (33%) | 6 (33%) | |
| Weight (grams) | 0.060 | ||
| N | 18 | 18 | |
| Mean (SD) | 4.2 (2.5) | 8.0 (6.8) | |
| Median (IQR) | 3.7 (2.5, 5.2) | 5.6 (3.2, 10.6) | |
| Range | 0.9, 9.9 | 1.4, 27.6 | |
| Sire | <0.001 | ||
| Alfred | 18 (100%) | 0 (0%) | |
| Nugget | 0 (0%) | 18 (100%) | |
| Dam | <0.001 | ||
| Kanto | 18 (100%) | 0 (0%) | |
| Loko | 0 (0%) | 18 (100%) | |
| Age (days) | <0.001 | ||
| 52 | 6 (33%) | 0 (0%) | |
| 54 | 0 (0%) | 6 (33%) | |
| 67 | 6 (33%) | 0 (0%) | |
| 69 | 0 (0%) | 6 (33%) | |
| 80 | 6 (33%) | 0 (0%) | |
| 82 | 0 (0%) | 6 (33%) | |
| n (%) | |||
| Fisher's exact test; Pearson's Chi-squared test; Wilcoxon rank sum test | |||
Pictures
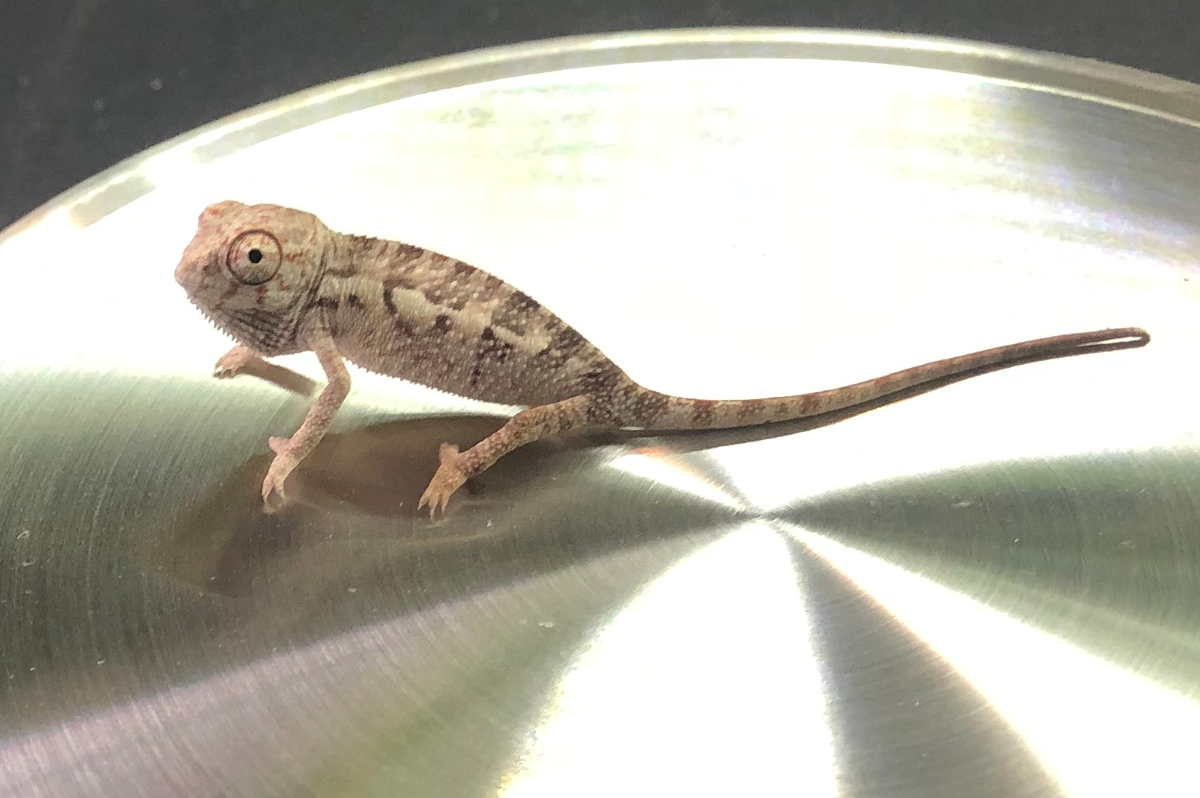
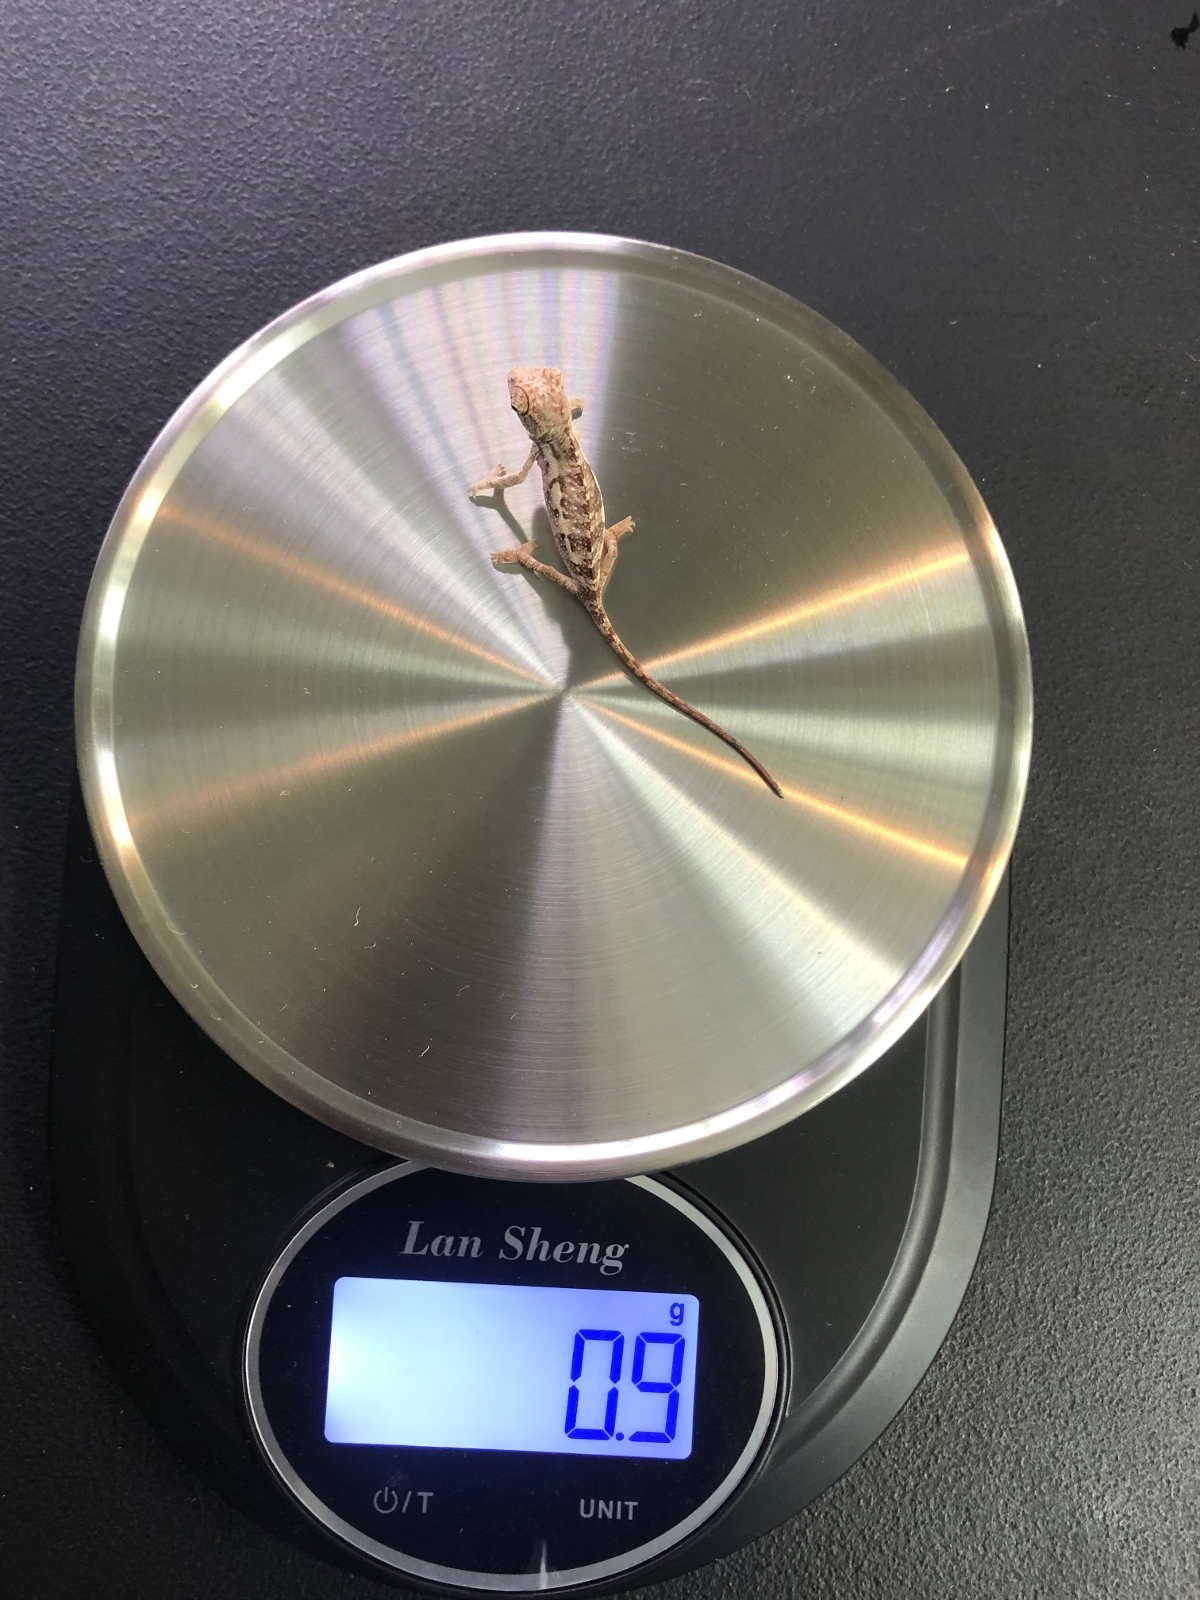
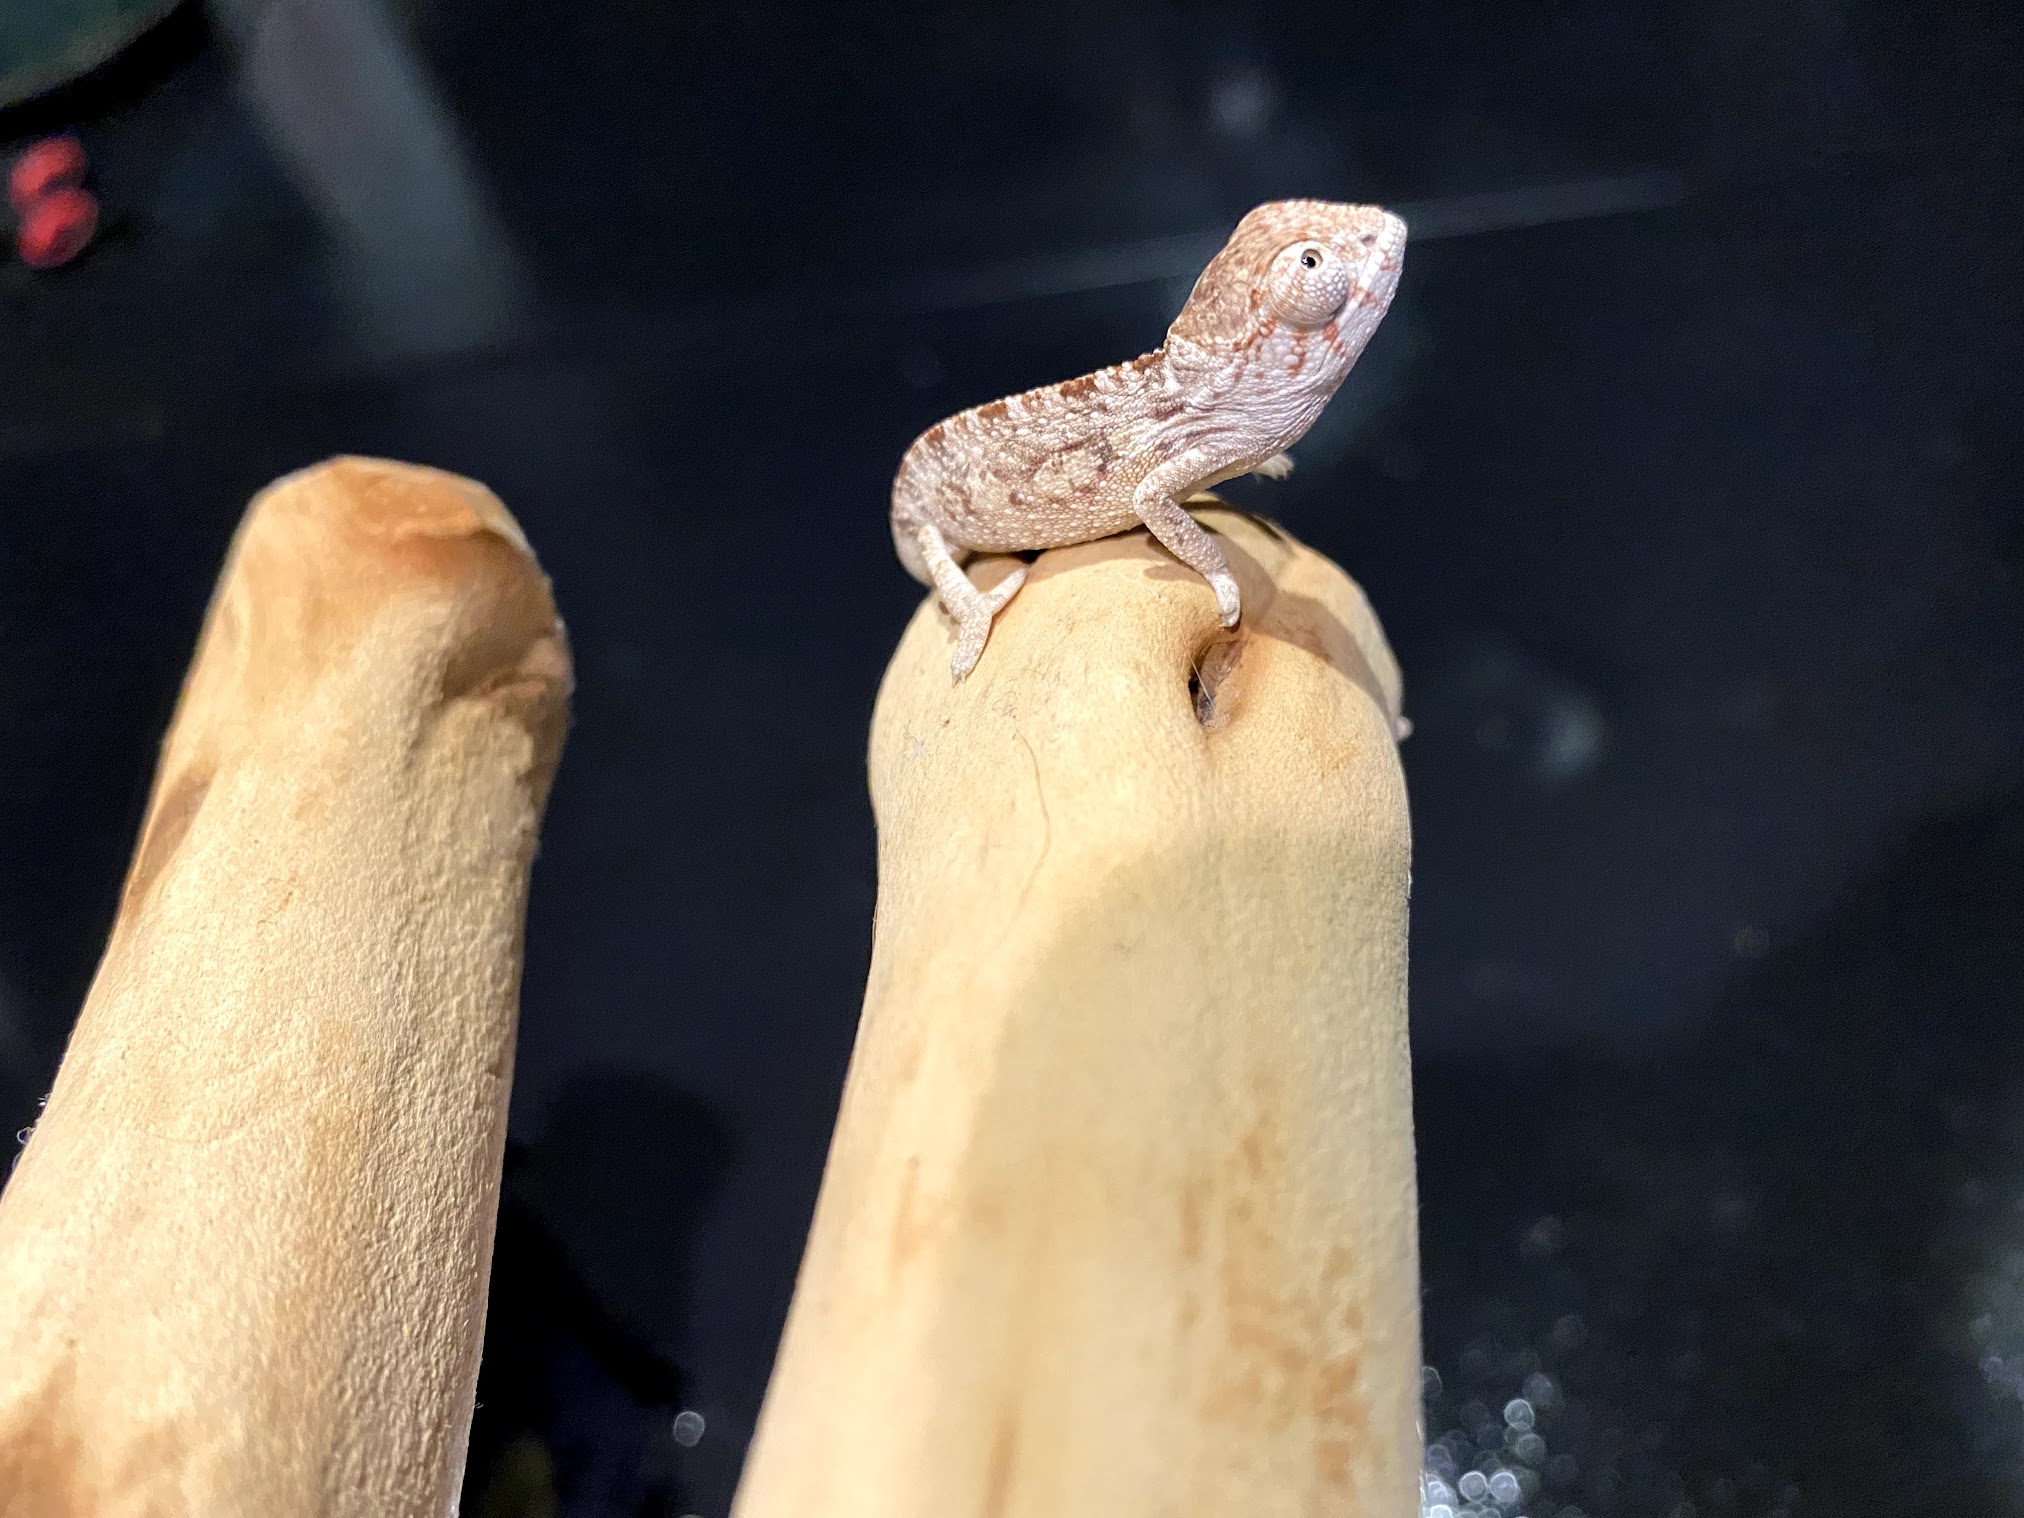
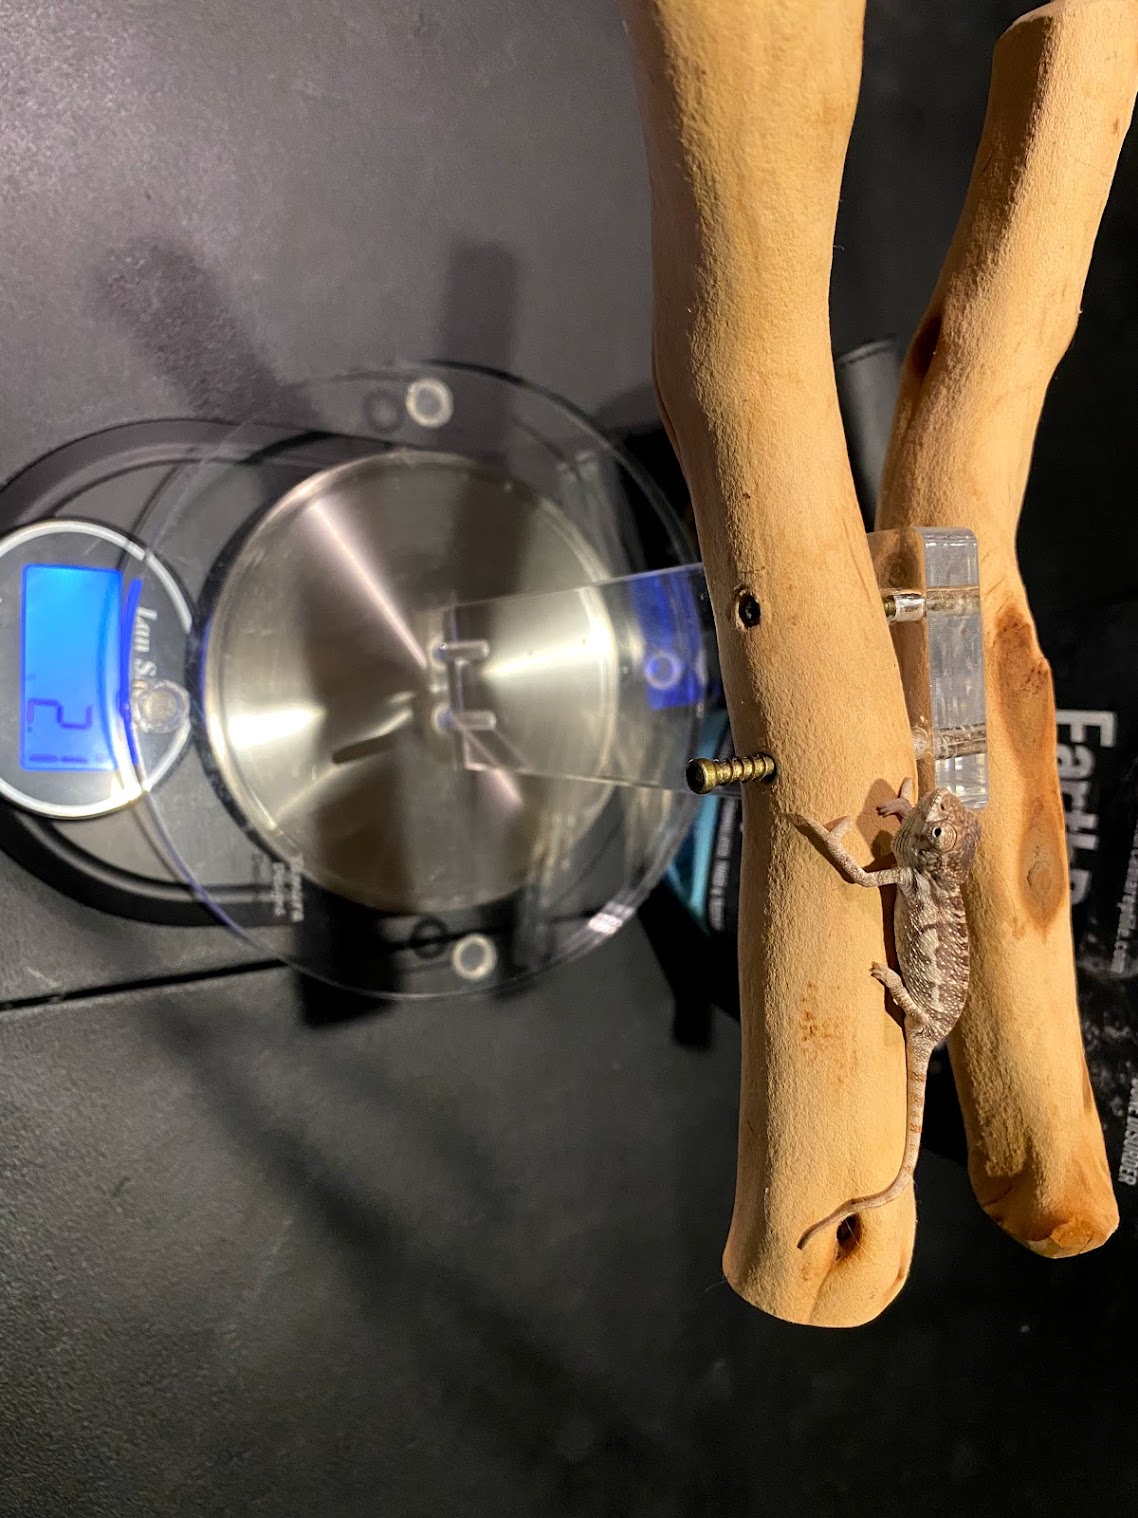
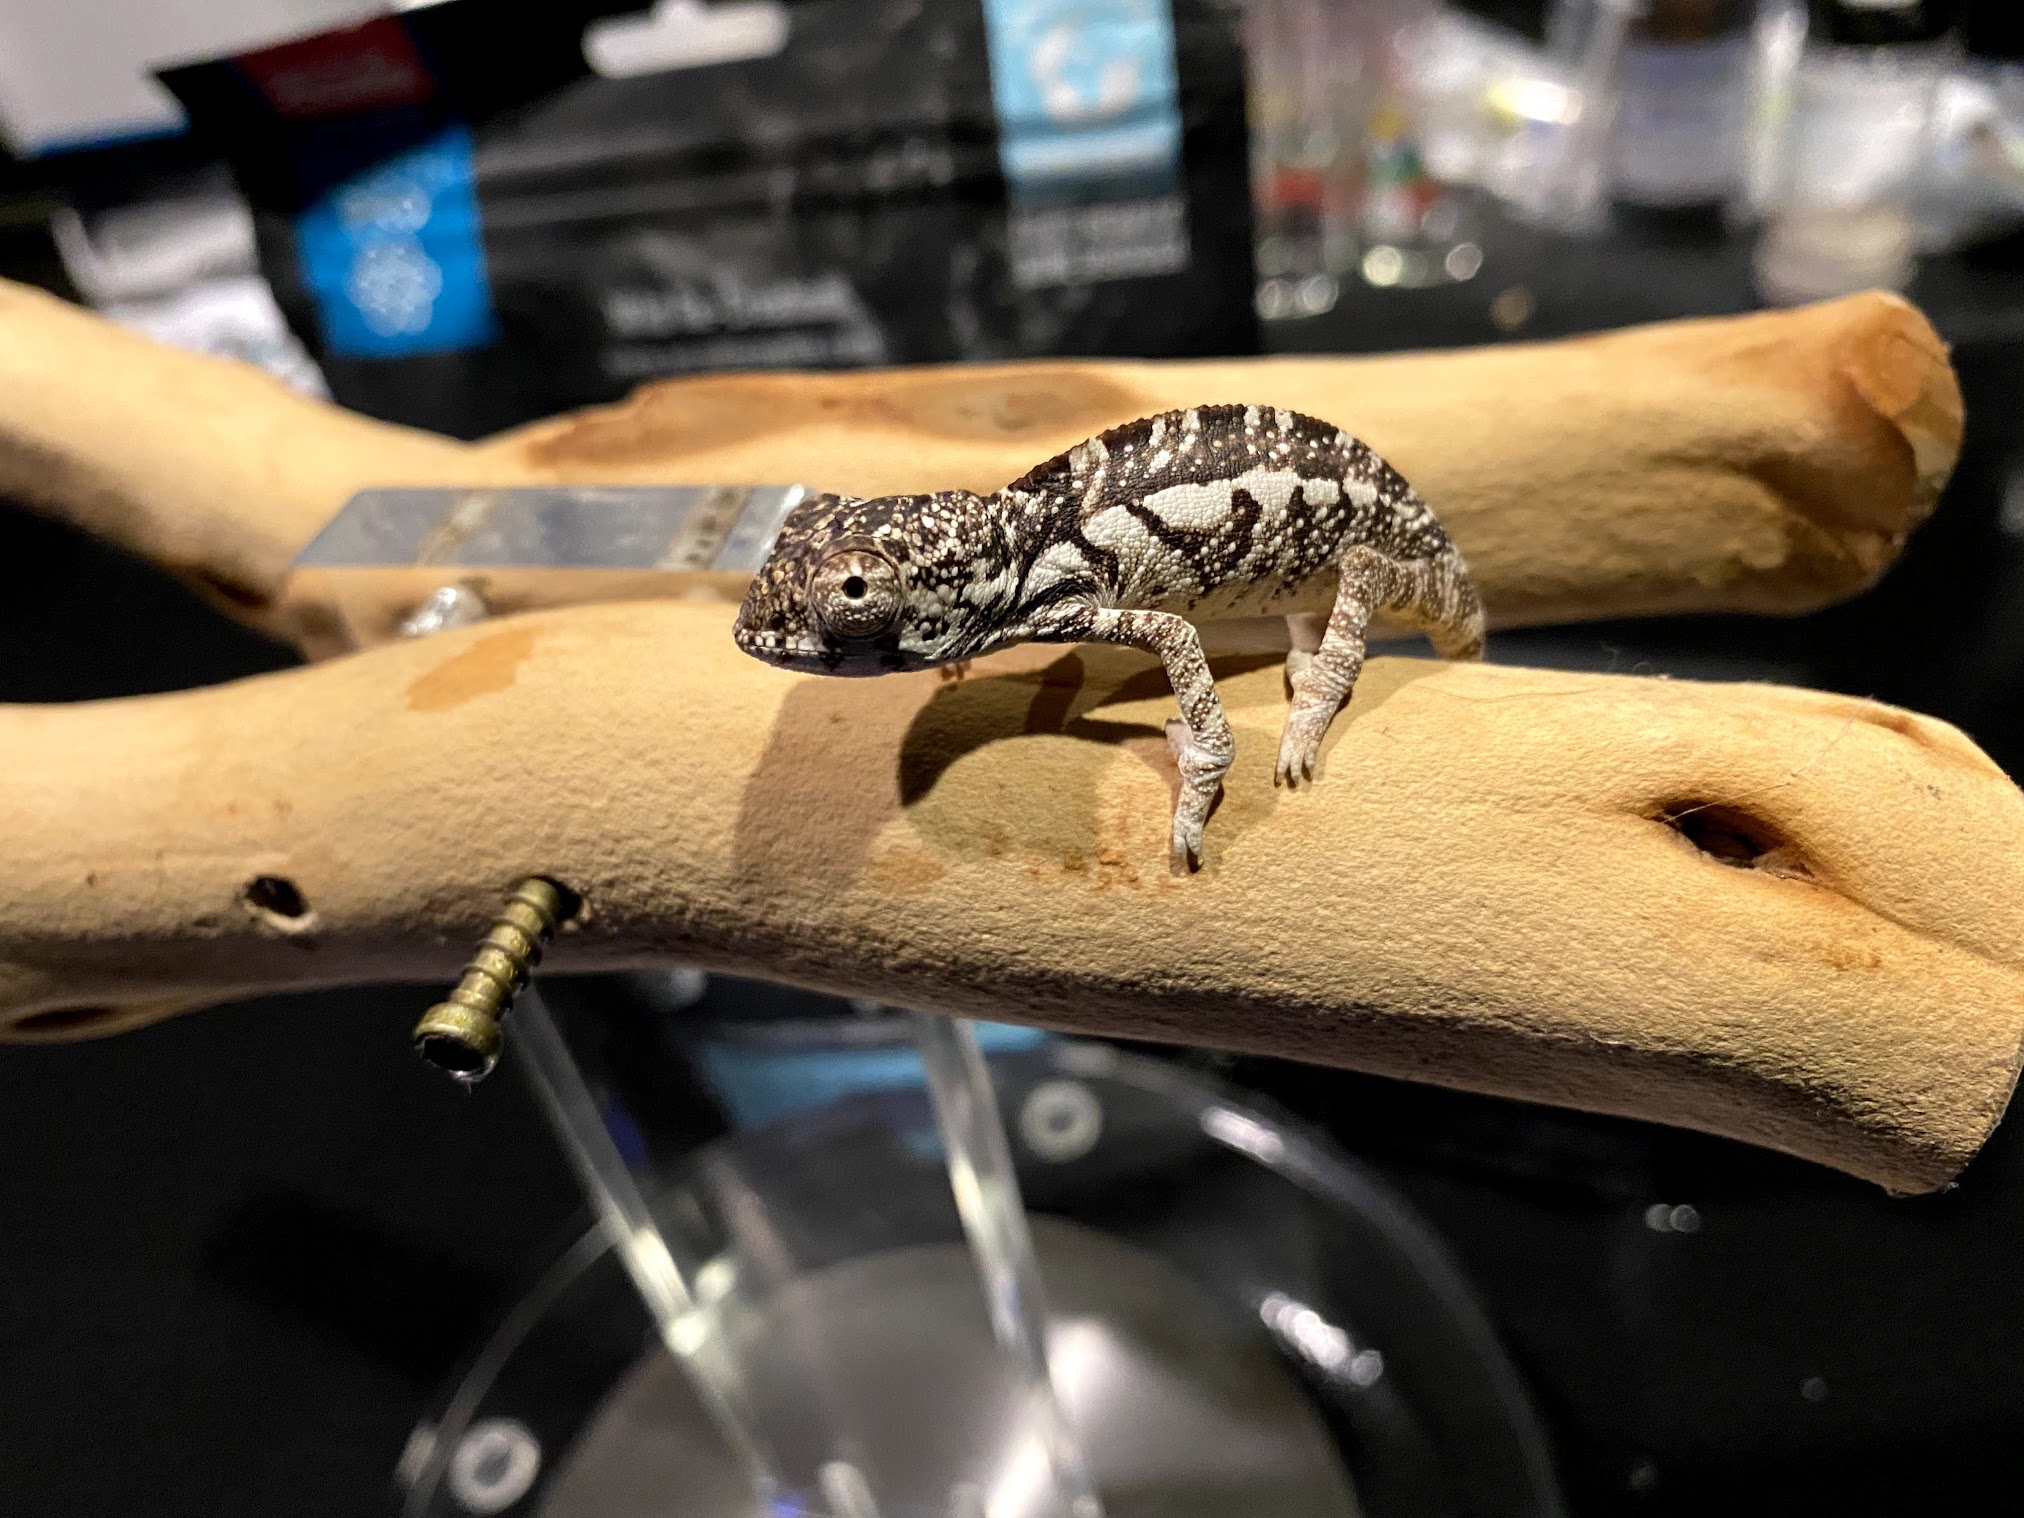
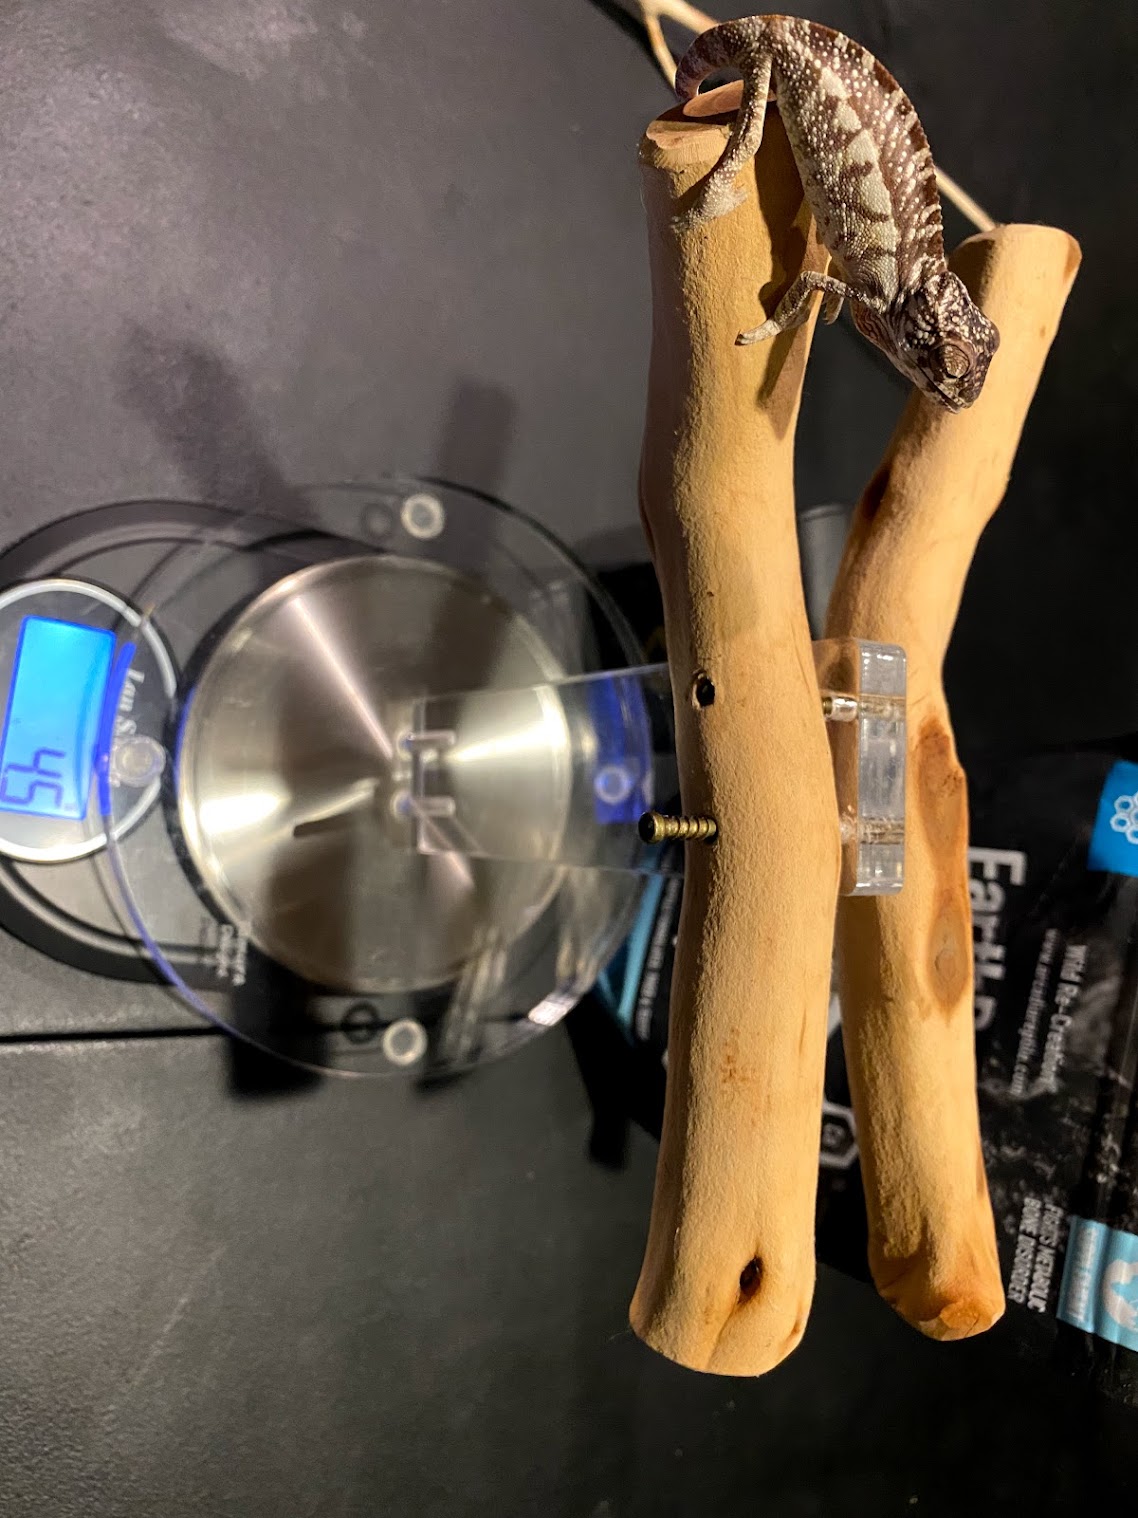
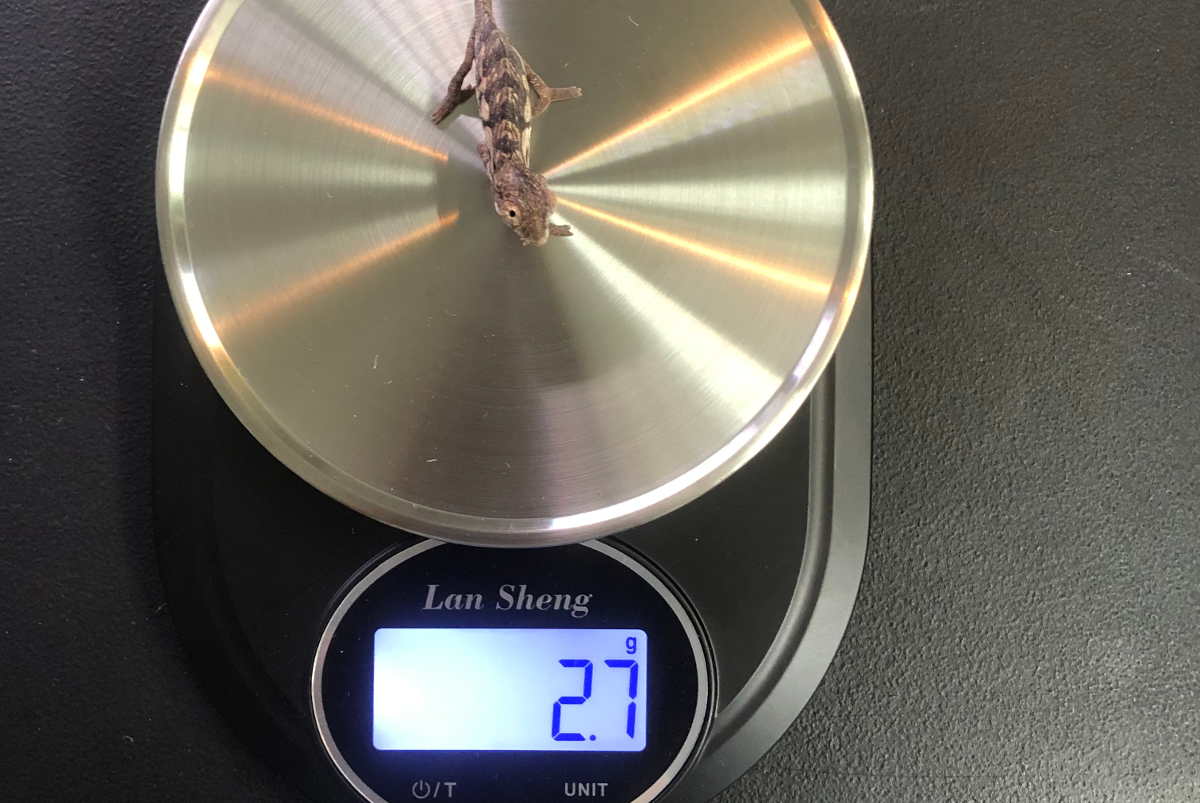
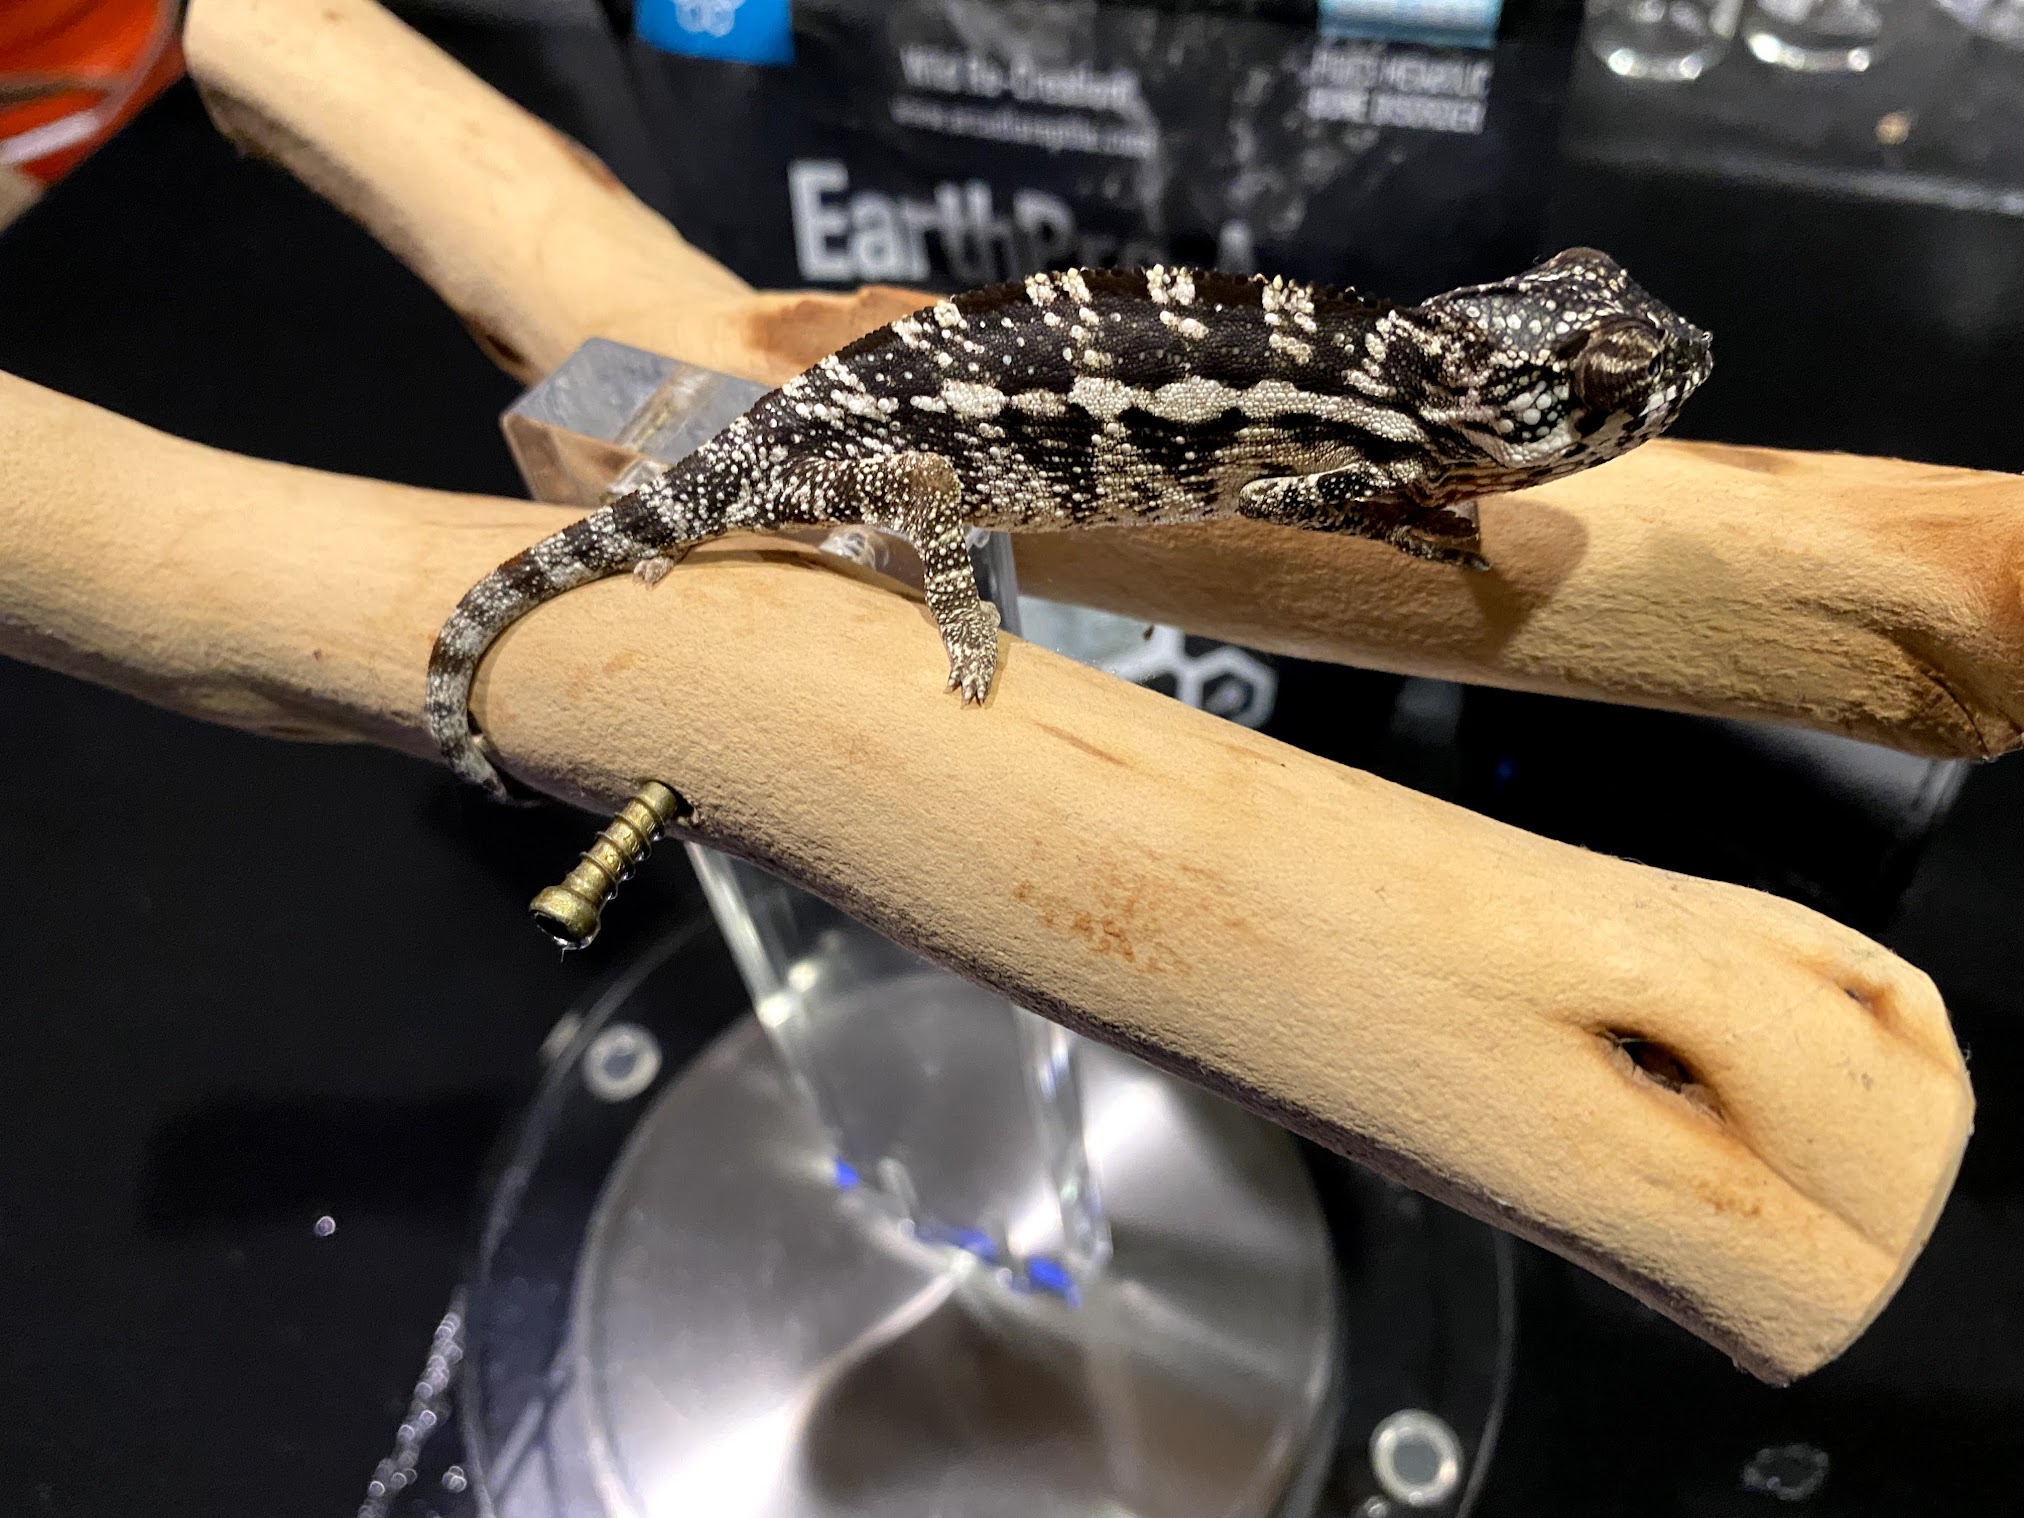
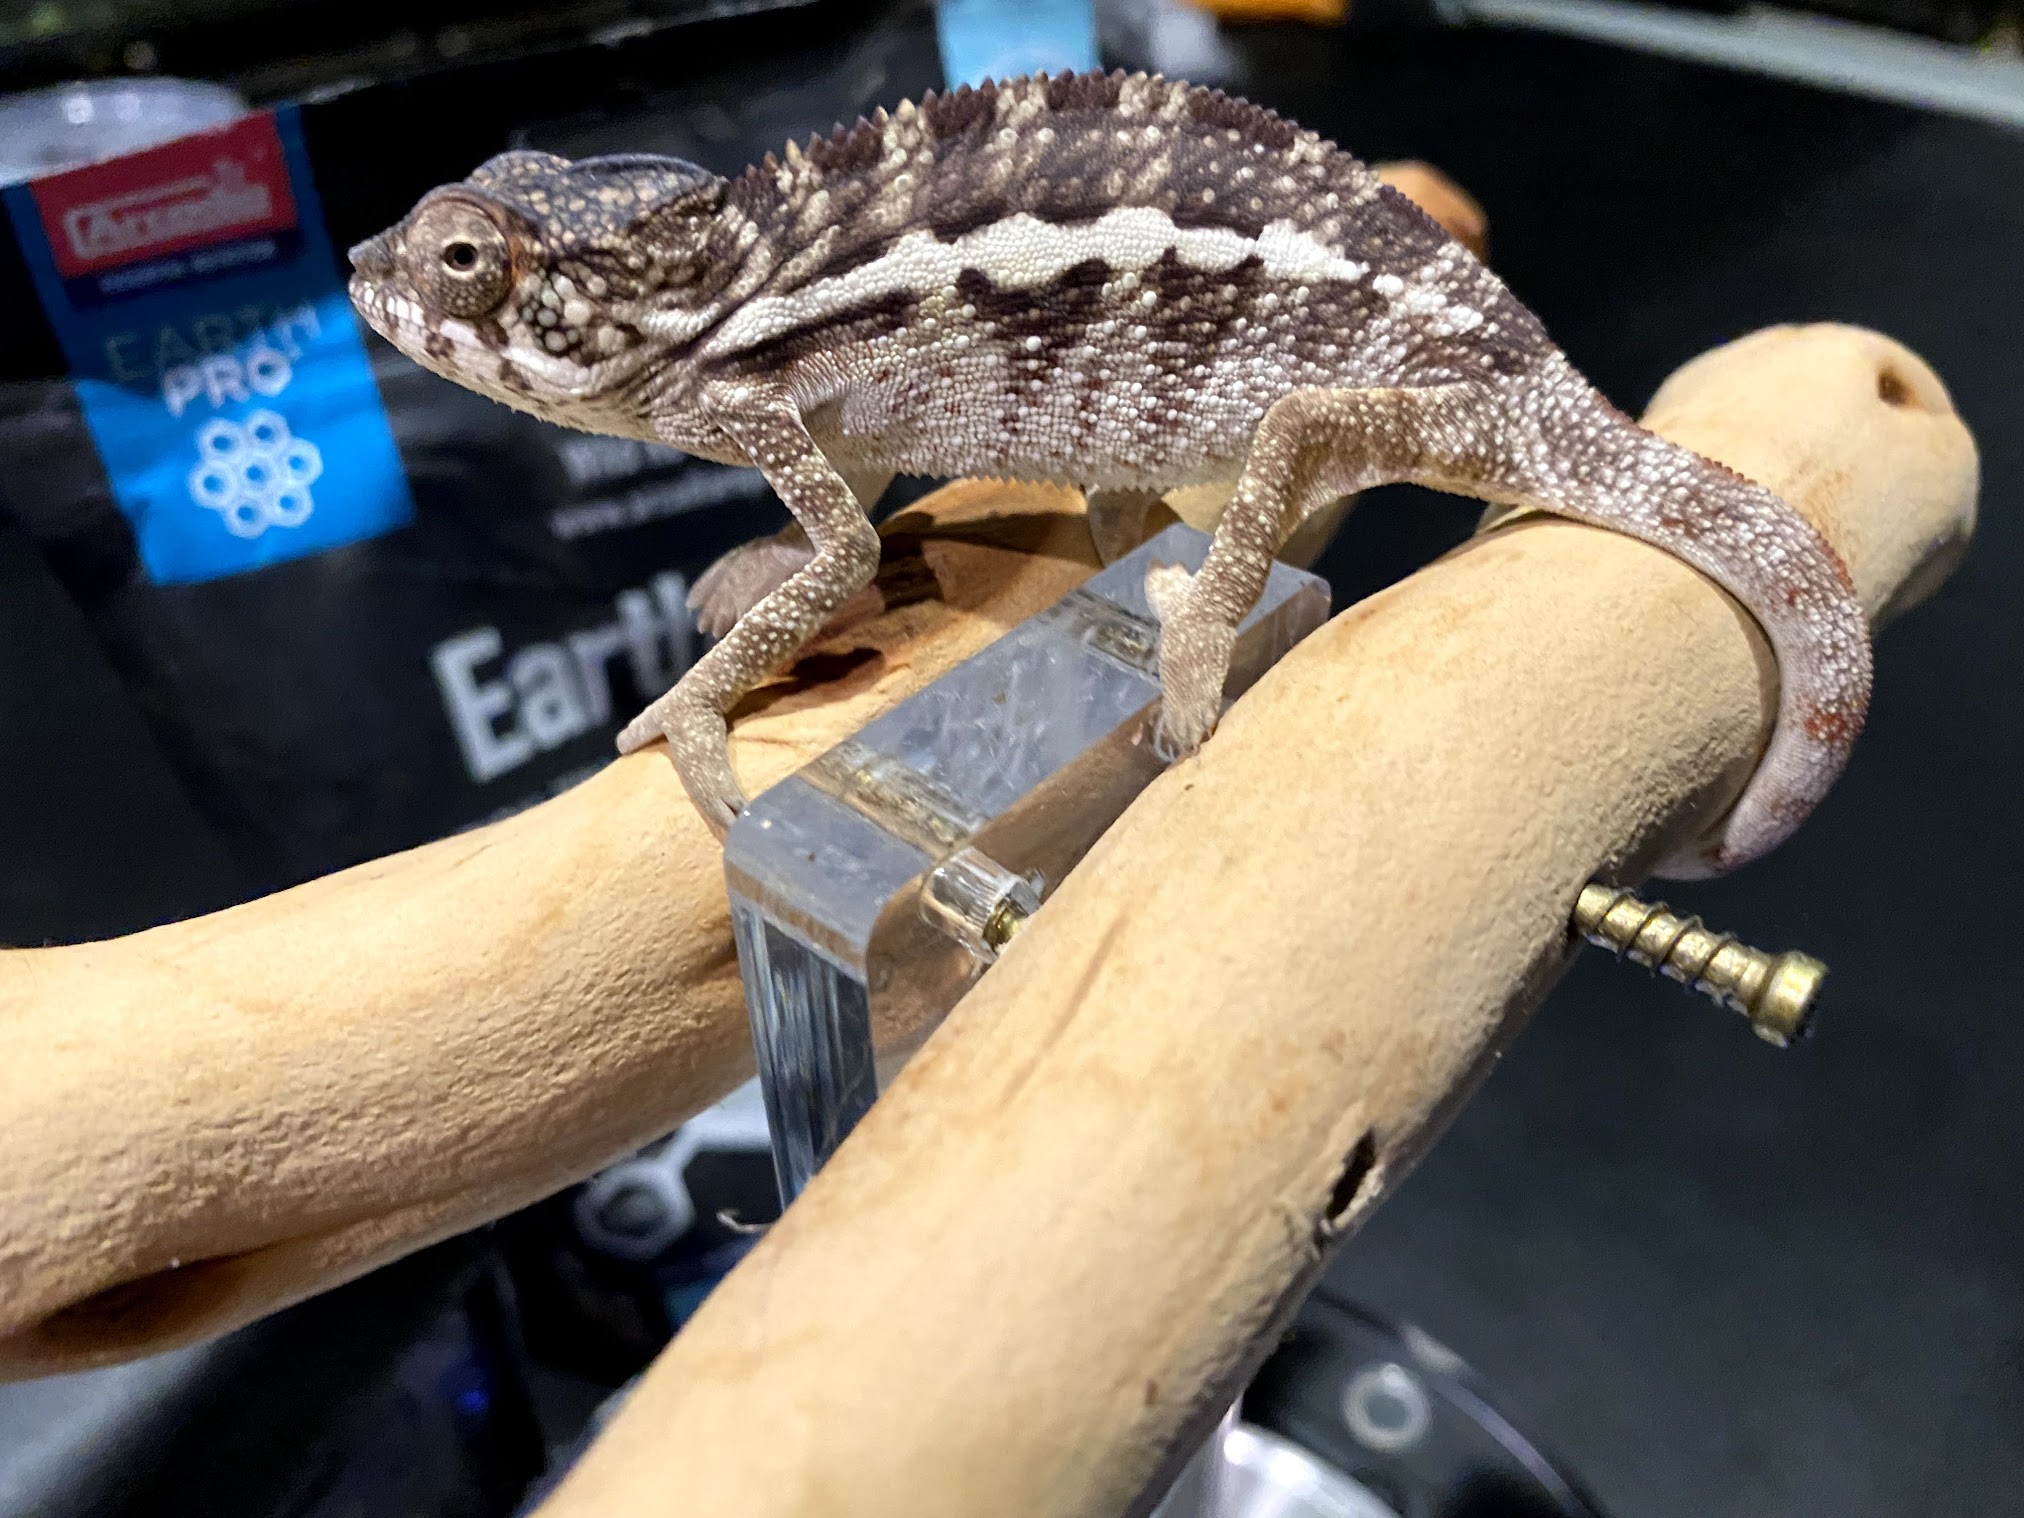
Along with the weight data, we took individual pictures. These data are very useful in identifying illness or genetic flaws that could explain any outliers on the small side.
Max UVI: 3
Cage A
Cage B
Cage C
Cage D
Cage E
Cage F
Max UVI: 6
Cage G
Cage H
Cage I
Cage J
Cage K
Cage L
These are galleries show the growth of each baby panther chameleon over a period of 6 weeks.

